Home Page
F.A.Qs
Statistical Charts
Past Contests
Scheduled Contests
Award Contest
| Online Judge | Problem Set | Authors | Online Contests | User | ||||||
|---|---|---|---|---|---|---|---|---|---|---|
| Web Board Home Page F.A.Qs Statistical Charts | Current Contest Past Contests Scheduled Contests Award Contest | |||||||||
|
Language: Easy Trading
Description Frank is a professional stock trader for Advanced Commercial Markets Limited (ACM Ltd). He likes "easy trading" -- using a straightforward strategy to decide when to buy stock and when to sell it. Frank has a database of historical stock prices for each day. He uses two integer numbers m and n (1 <= m < n <= 100) as parameters of his trading strategy. Every day he computes two numbers: P(m) -- an average stock price for the previous m days, and P(n) — an average stock price for the previous n days. P(m) > P(n) is an indicator of the upward trend (traders call it bullish trend), and P(m) < P(n) is an indicator of the downward trend (traders call it bearish trend). In practice the values for P(m) and P(n) are never equal.
When a trend reverses from bearish to bullish it is a signal for Frank to buy stock. When a trend reverses from bullish to bearish it is a signal to sell. 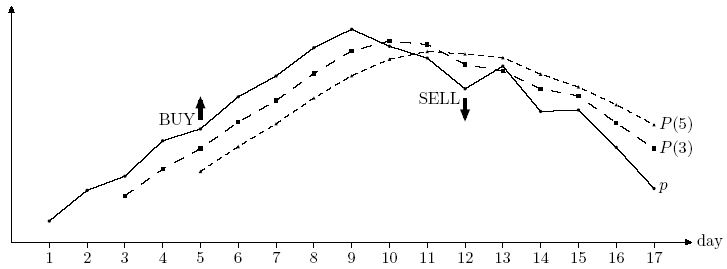 Frank has different values for m and n in mind and he wants to backtest them using historical prices. He takes a set of k (n < k <= 10 000) historical prices pi (0 < pi < 100 for 1 <= i <= k). For each i (n <= i <= k) he computes Pi(m) and Pi(n) — an arithmetic average of pi-m+1 . . . pi and pi-n+1 . . . pi respectively. Backtesting generates trading signals according to the following rules.
Your task is to write a program that backtests a specified strategy for Frank -- you shall print a signal for the first tested day (day n) followed by the signals in increasing day numbers. Input The first line of the input contains three integer numbers m, n, and k. It is followed by k lines with stock prices for days 1 to k. Each stock price pi is specified with two digits after decimal point. Prices in the input file are such that Pi(m) != Pi(n) for all i (n <= i <= k). Output Write to the output a list of signals -- one signal on a line, as described in the problem statement. Sample Input 3 5 17 8.45 9.10 9.40 10.15 10.40 11.08 11.52 12.12 12.51 12.15 11.90 11.25 11.73 10.77 10.80 10.01 9.14 Sample Output BUY ON DAY 5 SELL ON DAY 12 Source | ||||||||||
[Submit] [Go Back] [Status] [Discuss]
All Rights Reserved 2003-2013 Ying Fuchen,Xu Pengcheng,Xie Di
Any problem, Please Contact Administrator